Imagine a future in human health where cardiac muscles damaged by heart disease or spines devastated by cord injuries don’t just scar over but could be regrown to resume normal, healthy function. To realize this dream, scientists work to visualize the incredible power of other organisms — such as zebrafish and flatworms — to regrow their tissues and organs following injury.
Their tool of choice? Fluorescence microscopy.
Fluorescence works like a visual microphone, amplifying otherwise inaccessible cellular and subcellular details and interactions. Given the forceful link between seeing and knowing, it’s perhaps impossible to imagine modern science without fluorescence microscopy. Today, engineers are pushing a wide array of fluorescence imaging approaches to visualize biology with ever higher precision, at greater depths, and in more dynamic live imaging contexts.
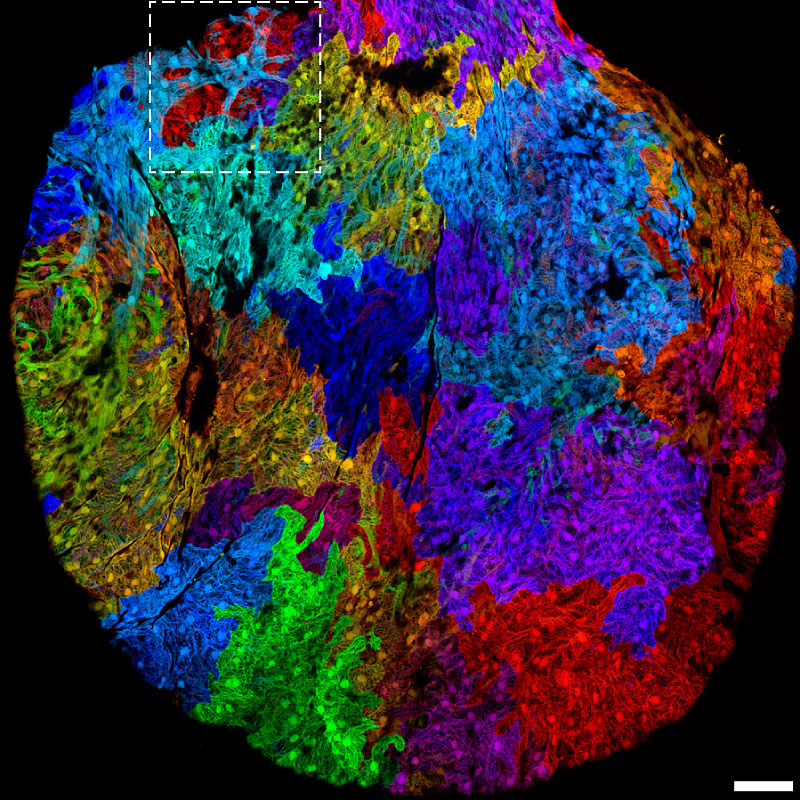
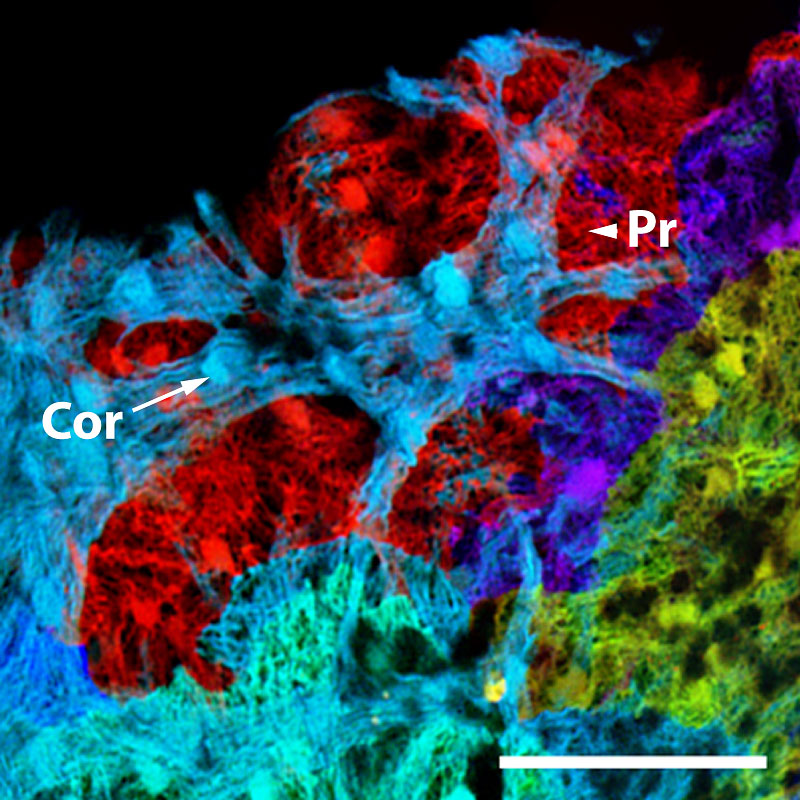
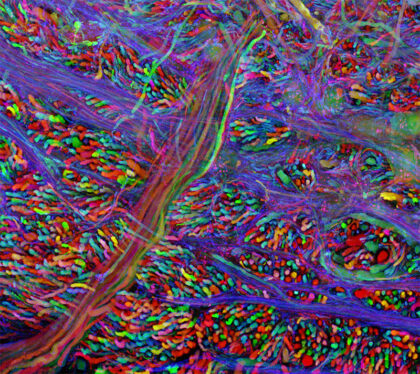
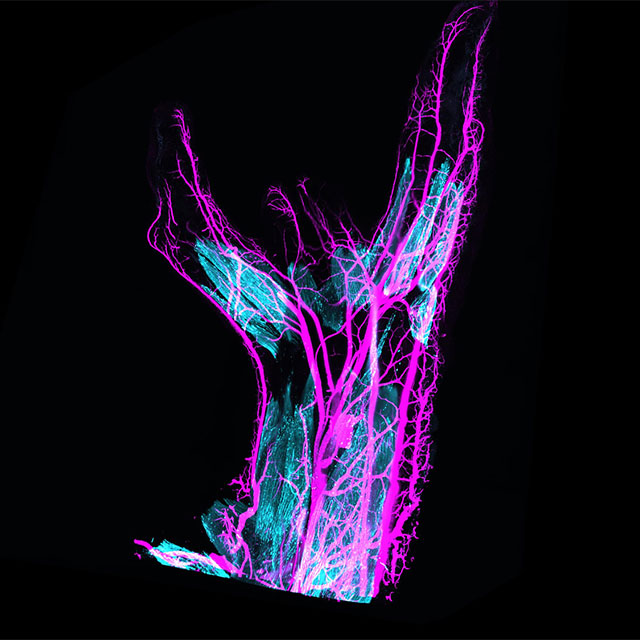
Here, the lab of developmental biologist Kenneth Poss, now Director of Regenerative Biology at the Morgridge Institute for Research, integrated a variety of fluorescent hues into zebrafish — effectively color-coding the different muscle cells that form into the adult zebrafish heart. With this multicolor analysis, the group revealed for the first time two previously unknown layers of the wall surrounding the heart’s ventricle. The discovery, made over a decade ago, opened a path for the group to explore how molecular factors control movement and division of heart muscle cells during regeneration.
This is the kind of fundamental knowledge that will be critical to one day transforming the way we treat human injury and disease. And it’s all made possible by light.
Light is made up of massless particles called photons, the tiniest possible packets of electromagnetic radiation. When photons hit special molecules responsible for fluorescence — called fluorophores — they excite electrons that had been buzzing around at their most stable “ground state.” The excited, higher energy state does not last long. During relaxation, the fluorophores re-emit the light they had absorbed. This time, the light has a longer wavelength and thus a different color.
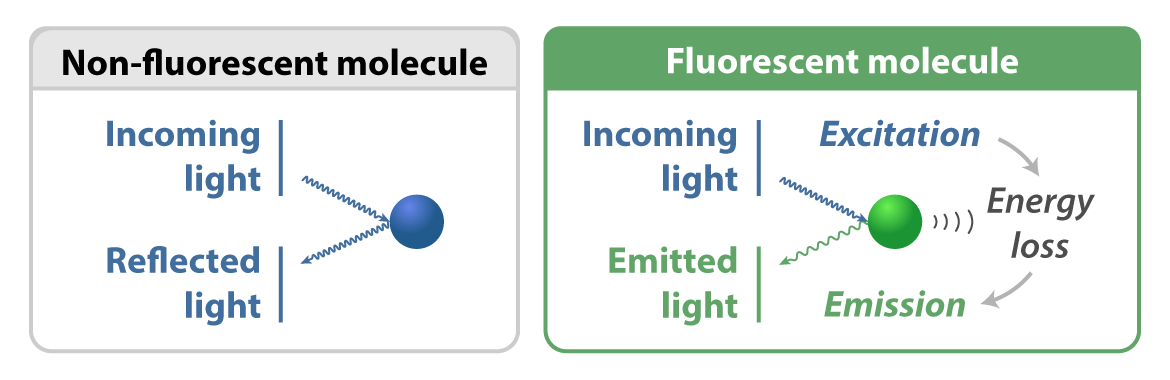
This is fluorescence, and it all happens in billionths of a second — about 200 million times faster than the blink of an eye.
Why fluorescence?
As a tool leveraged across the life sciences, fluorescence tackles two fundamental challenges of viewing life under the microscope.
Challenge one: microscopic life is complex.
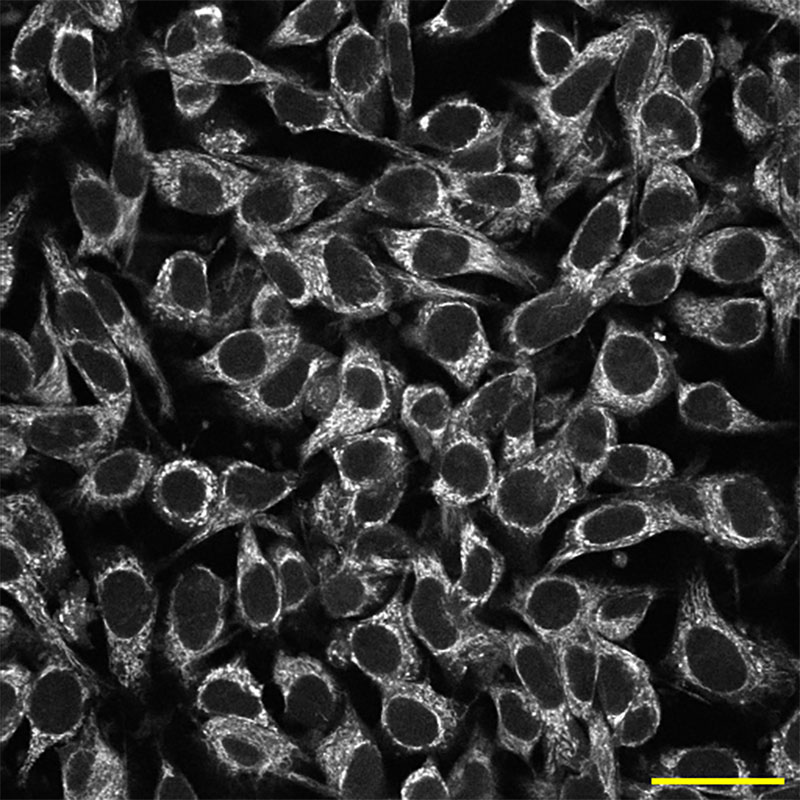
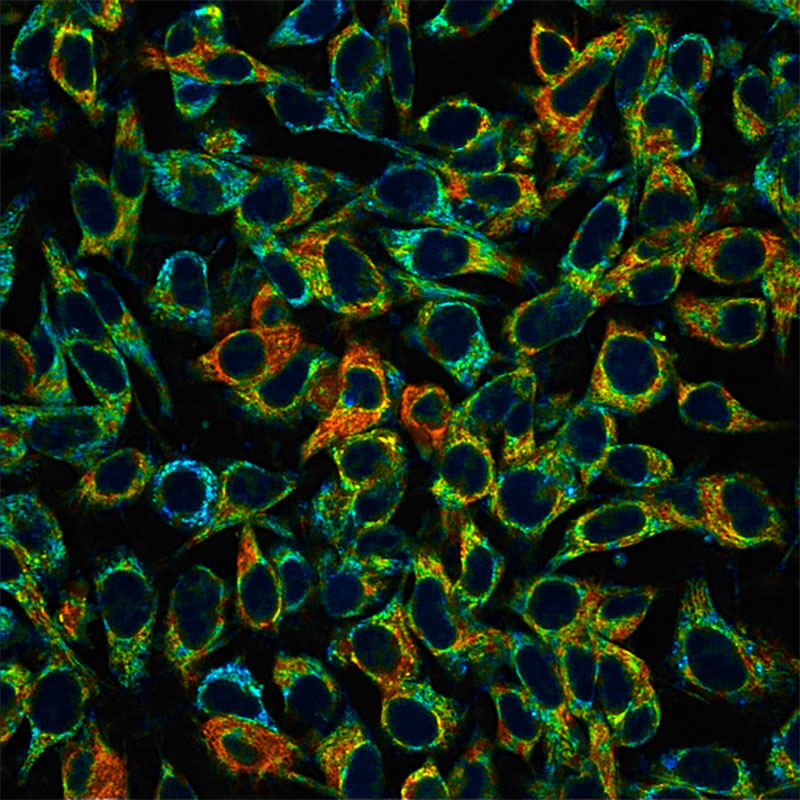
The iconic cartoon cross sections of cells found in biology textbooks tucks every component into an orderly and static place. But in real life, a complex orchestration of constantly moving cellular machinery makes locating the thing you want to see difficult. The multicolor possibilities of fluorescence microscopy are especially helpful in this regard. In the example here, different colors illuminate nuclei (blue), a protein called actin (red), and a critical cytoskeleton component, microtubules (cyan), in a human cell.
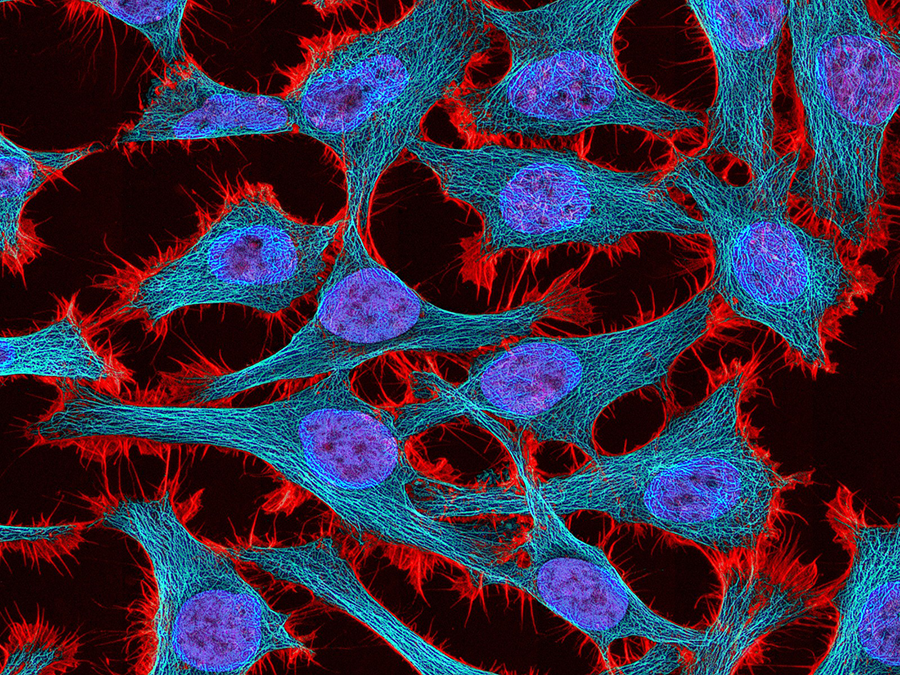
HeLa cell nuclei (blue), actin (red), and microtubules (cyan) viewed with fluorescence microscopy. Image: Tom Deerinck, NIH
Challenge two: microscopic life is transparent.
Humans — and most other organisms, for that matter — are mostly made up of water, whose transparency allows light to pass right through. That’s why this zebafish, illuminated with brightfield microscopy, appears almost indistinguishable against the background compared to its fluorescent counterpart.
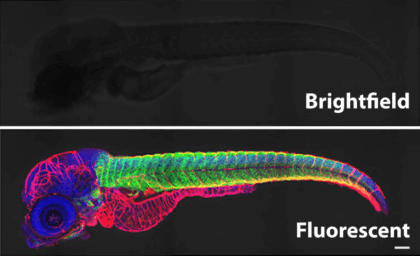
A maturing zebrafish visualized with brightfield microscopy (top) and with an image combining fluorescent labeling of muscles with several colors. (Scale bar, 100 micrometers.) Adapted from He et al., 2020
Fluorescence imaging can produce the contrast that watery tissues, cells, and subcellular features don’t naturally show. And it can help locate the precise thing you want to study. Knowing what cellular neighborhood a protein or other molecule of interest resides in — say the nucleus, cytoplasm, mitochondrion, or membrane — and who its other neighbors may be, provides incredibly important information.
This is the information that helps reveal and track fundamental cellular processes like metabolism, map the spread of diseases like cancer and Alzheimer’s, and even make decisions about where in the cell drugs could most effectively target a disorder.
What you see here is a key moment in cell structure dynamics, lit up with fluorescence, that allows cells to “drink” extracellular fluids. Cancer cells use this process to feed themselves and fuel their growth, but there is also increasing interest in using it as a potential backdoor through which drug therapies can enter cells.
With fluorescence microscopy, researchers discovered a protein called Phafin2 (green) shows up at the ruffled cell membrane (red) during macropinocytosis — the process by which cells take up extracellular fluids — leading them to elucidate the key role Phafin2 plays in the process. (Scale bar, 5 micrometers.) Schink et al., 2021
Dive in to learn about how fluorescence microscopy works, how it has evolved over more than a century, and how Wisconsin scientists are accelerating its advance in a new era of biomedical research.
How does fluorescence microscopy work?
Fluorescence microscopy encompasses dozens of possible approaches. Among these, you’ll choose one or a combination that is most likely to answer the biological question that motivates you — and that is within your resources. (Some of the most cutting-edge techniques remain specialized and expensive.)
But fluorescence imaging of all varieties requires three critical components:
- Fluorophores in the biological sample that will highlight where the molecules or interactions of interest are;
- Microscopes that will illuminate the sample to induce fluorescence and detect it to form images; and
- Computational techniques (packaged in software) that will process and often help interpret those images.
Sources of fluorescence
To make the biology you want to see shine brightly in subsequent imaging, you’ll generally first “label” it with a fluorophore. These labels, also known as “tags” or “probes,” include dyes that can label specific molecules within cells and special fluorescent proteins that can be introduced into an organism through gene editing technology to label specific molecules. In a technique called immunofluorescence, fluorophores can be hitched up (“conjugated”) to an antibody that will be used to find specific proteins of interest.
While external tags can sometimes bind to the wrong molecule, this specificity — addressing that major challenge of localization — is one of the key advantages of using labels. The brightness of these tags also creates a strong “signal” in the resulting images. With a good signal-to-noise ratio, the things you want to see stand out starkly against the background (“noise”) you don’t care about. But fluorophores can only undergo so many cycles of absorption and emission before they begin to fade and become permanently unusable, a process called photobleaching. And illumination can also cause some fluorophores to become toxic to the cell. These problems mean the time frame for viewing any biological process is limited.
Spotlight on Green Fluorescent Protein (GFP)
You’ll have guessed from its name the kind of light emitted by green fluorescent protein, or GFP. You may not know that the story of GFP’s discovery and evolution is one of the most fascinating in the history of science, punctuated by a Nobel Prize for Osamu Shimomura, Martin Chalfie, and Roger Tsien in 2008.
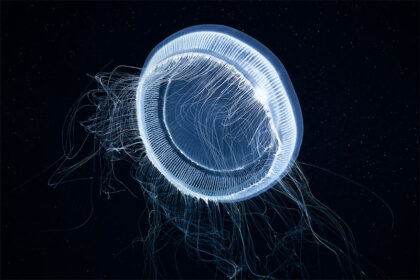
An Aequorea jellyfish. Credit: Alexander Semenov, via Flickr
In the summer of 1961, Shimomura and his colleague Frank Johnson were collecting material — they called it “squeezate” — from thousands of bioluminescent Aequorea victoria jellyfish in Friday Harbor off the Washington coastline. Shimomura and Johnson set out to purify a protein from the jellyfish called aequorin, which emits blue light when it binds with calcium. But they also discovered a “greenish fluorescence” that became visible when the jellyfish specimens were gently stimulated or put under ultraviolet (UV) light. This is GFP.
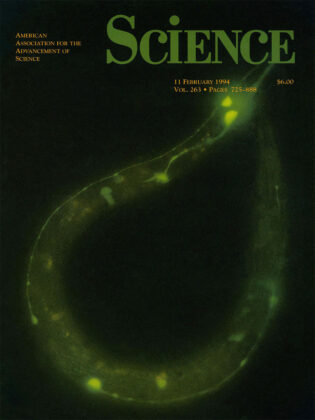
Chalfie et al. first published on their use of GFP to label worm neurons in Science, 1994.
Nearly thirty years later — or “a little after noon on Tuesday, April 25, 1989” — Martin Chalfie learned about GFP from a speaker in a seminar series at Columbia University in New York. A researcher of the translucent model organism, the worm Caenorhabditis elegans, Chalfie realized that GFP could be extremely powerful as a biological marker if it could be imported into a new organism to label biology of interest. After a series of trial and error to build the methods needed, Chalfie and his colleagues did just this to study neurons in C. elegans.
In the 1990s, Roger Tsien took the power of GFP to label molecules of interest and supercharged it, discovering ways to make it glow more intensely and even to glow in different colors like cyan, blue, and yellow. Based on work Tsien’s research group did with red fluorophores, scientists can now visualize multiple processes happening simultaneously in all the colors of the rainbow. This paved the way for “brainbow” multicolor labeling, shown here in the human brainstem.
A human brainstem lit up in many colors by fluorescent proteins. Credit: WBUR, from brainbow pioneer Jeff Lichtman, via Flickr
The question that brought about the discovery of GFP was “Why does it glow?” — not “How can we harness this tool?” But GFP turns out to be an extra special tool. Compared with other fluorophores that depend on other chemical events to emit light, GFP only requires the presence of oxygen to fluoresce, making it much simpler to use as a label. Plus, the gene editing technologies that allow GFP to be inserted into the DNA of another organism means that gene expression and protein behavior can be tracked over generations to follow things like disease inheritance or the lineage of stem cells into specialized cell types.
Ironically — given the aid GFP has lent in solving biological mysteries — one question remains unanswered: why the jellyfish in which it was first found evolved to have this incredible capability!
In label-based techniques, any naturally occurring “autofluorescence” in your cells can pose a problem, creating more unwanted noise. That’s right: you glow, too! With autofluorescence imaging, scientists turn this nuisance into a virtue, exploiting the naturally occurring fluorophores in the human body and other living organisms. Autofluorescence imaging is one of many label-free techniques that — while they are not always as specific and generally create weaker signals — come with their own special advantages. Without any of the possible toxicity or disruption of natural biological processes caused by adding labels, label-free imaging creates a window into a more undisturbed biological system.
Here scientists captured the autofluorescence of NAD(P)H, a molecule involved in many metabolic reactions, in mouse melanoma cells.
NAD(P)H intensity image of mouse melanoma cells in vitro. (Scale bar, 50 micrometers.) Credit: Alexa Heaton
Illumination and imaging
Fluorescence imaging comes in an array of microscope configurations, all of which involve shooting a beam of light at a sample, exciting the fluorophores within it to induce fluorescence, and recording pictures of this phenomenon.
To appreciate how this dynamic process works, we need to know a little bit about the complex but utterly fascinating physics of light.
What is (fluorescent) light?
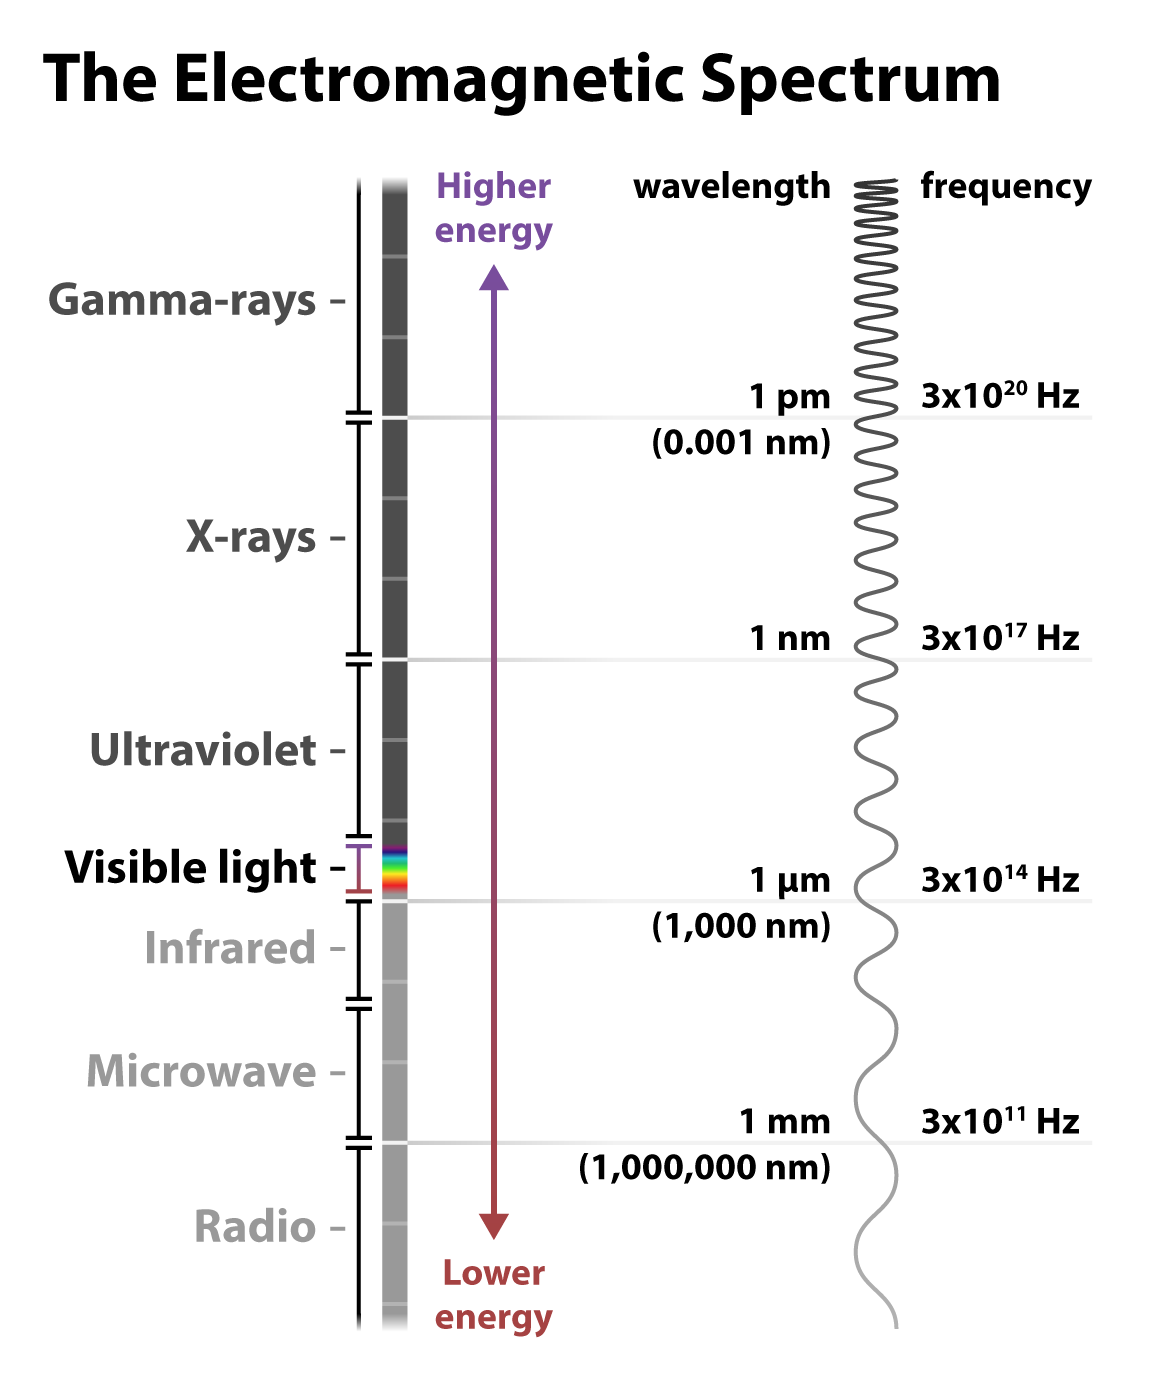
Recall that light can be understood as particles called photons — those tiny packets of energy in the form of electromagnetic radiation. Light can also be understood as waves of electromagnetic radiation. These waves have two important measurements: wavelength, or the distance between peaks, and frequency, or the number of peaks that occur per second. The longer the wavelength, the lower the frequency, and the less energy the wave has — and vice versa for shorter wavelengths and higher frequencies.
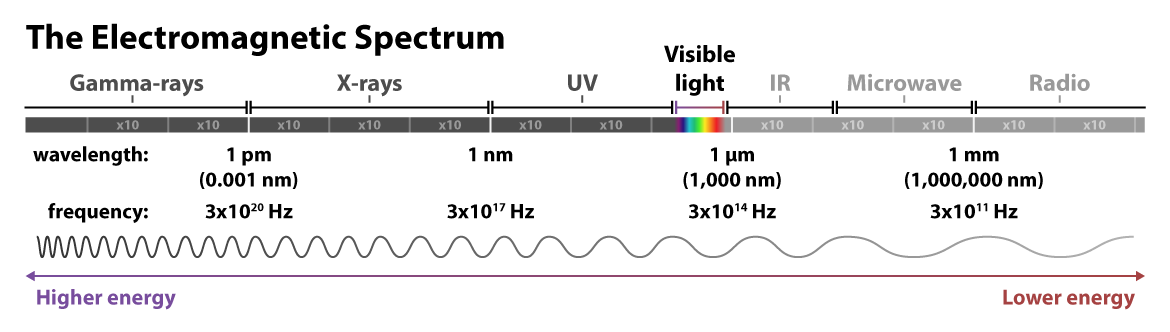
Visible light is just a small fraction of the electromagnetic radiation spectrum. At the higher energy end of the spectrum are nearly unfathomably short and frequent gamma rays: wavelengths measured in one trillionths of a meter, and peaks on the order of a 3 with 20 zeros after it occurring within a single second! At the lower energy end of the spectrum, radio waves travel with much longer wavelengths, up to kilometers, and at lower frequencies.
Visible light is just a small fraction of the electromagnetic radiation spectrum. At the higher energy end of the spectrum are nearly unfathomably short and frequent gamma rays: wavelengths measured in one trillionths of a meter, and peaks on the order of a 3 with 20 zeros after it occurring within a single second! At the lower energy end of the spectrum, radio waves travel with much longer wavelengths, up to kilometers, and at lower frequencies.
Most relevant to fluorescence imaging is the ultraviolet and visible light towards the middle of the spectrum of electromagnetic radiation. Indeed, fluorescence microscopy is so adaptable for biological imaging, including in live cells, because the longer wavelengths of the visible light spectrum don’t drastically damage the sample as in short-wavelength techniques such as cryogenic electron microscopy. Most fluorophores absorb light in the UV or visible range and emit light in the visible range. This familiar rainbow of colors covers a range of wavelengths measured in nanometers (nm), or billionths of a meter. Fluorescent light — re-emitted light — is a different color than the light absorbed because energy is lost in the process of relaxing from the temporary higher-energy state, resulting in a lower-energy and different color wavelength.
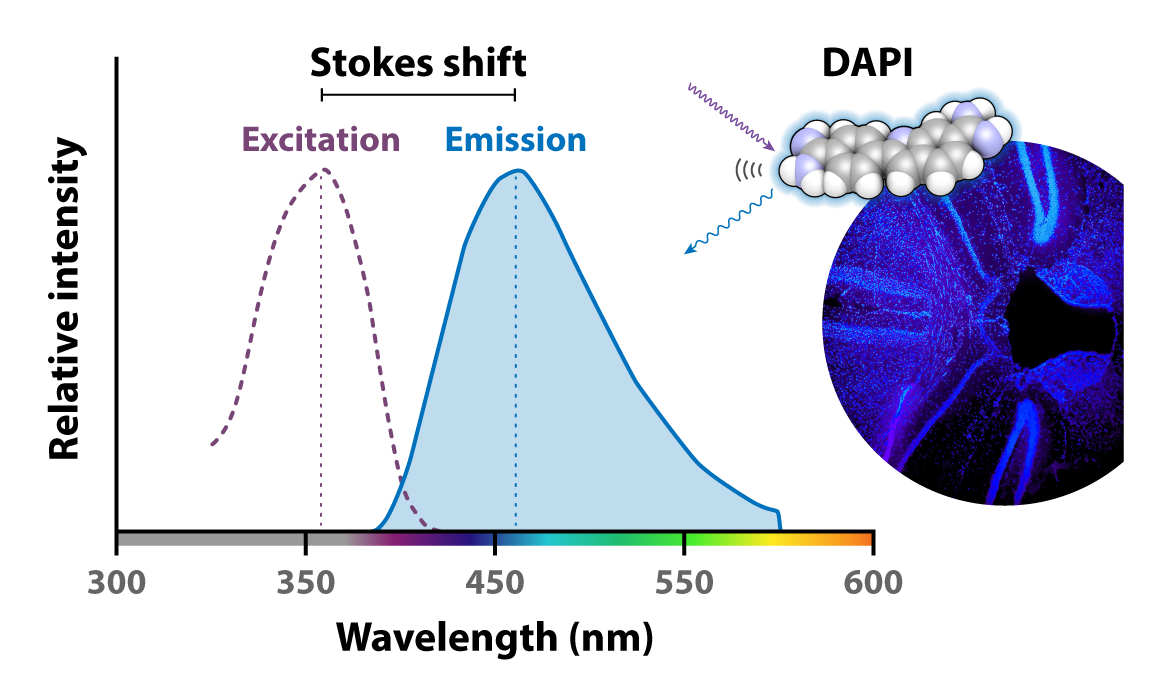
Different fluorophores respond to different energies of illumination light, so picking the right combination is a key step to any experiment. The relationship between illumination and excitation energy is mapped in diagrams like this one, shown for the popular fluorescent dye DAPI frequently used to stain the nuclei of fixed cells. DAPI’s maximum excitation peak is 358 nm (x axis, purple dotted line) — the wavelength it absorbs most efficiently. Its maximum emission wavelength is 461 nm (x axis, blue), at which its fluorescence will be the most intense (indicated by the height of the y axis). The area under these curves tells us that DAPI will absorb and re-emit light at other wavelengths too, but with less intensity. Minimal overlap is ideal here, as the area where the curves overlap is where it would be challenging to distinguish light that excites the fluorophore from light that is emitted.
Now, let’s follow the light!
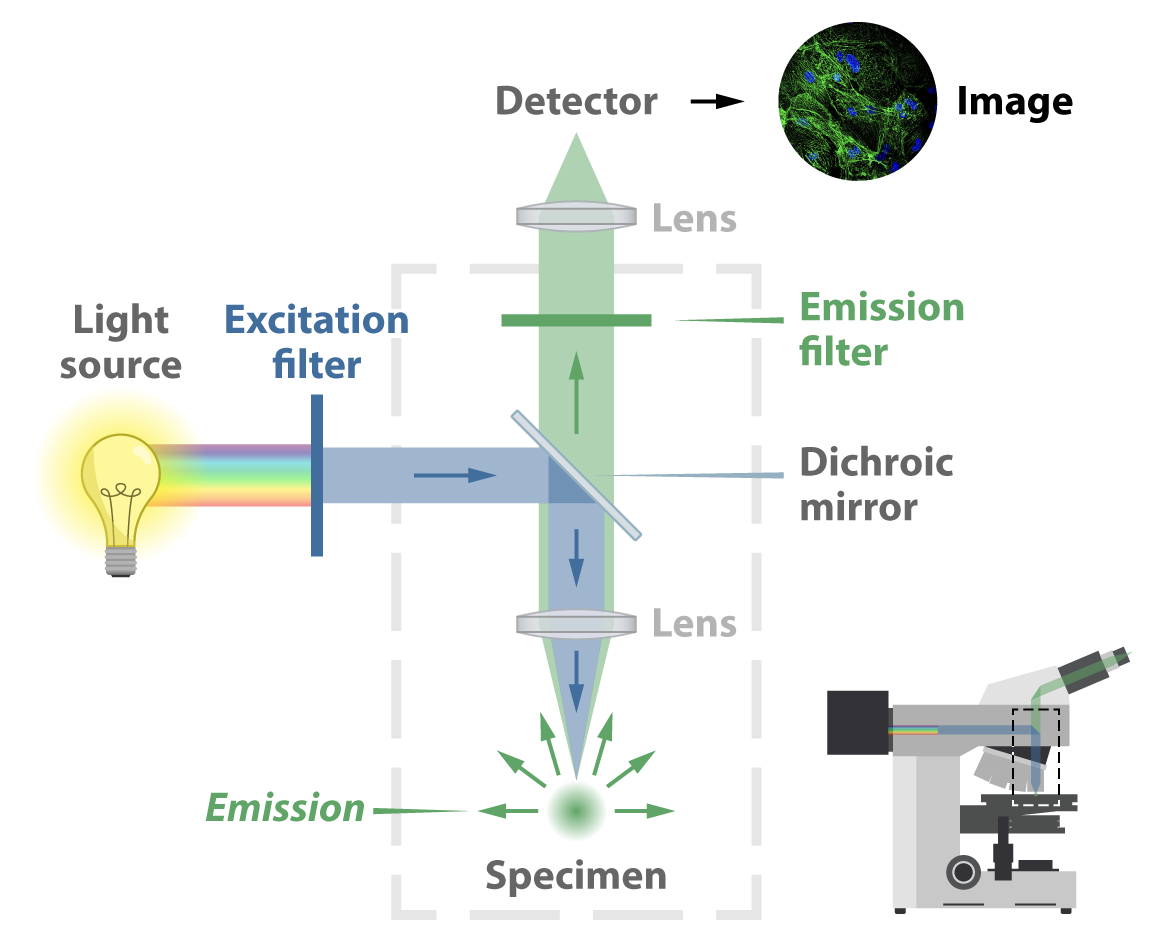
In a traditional widefield epifluorescence microscope, illumination most often comes from a gas arc lamp or an LED source. This light is a multispectral band, meaning it covers many wavelengths, typically in the UV and higher-energy visible range. First it passes through an excitation filter designed to allow just the right wavelength to pass forward. This light then hits a special dichroic mirror — also called a beam splitter for its capability to transmit only certain wavelengths. The mirror redirects the light down through an objective lens and finally onto the sample. Fluorescent light then emits from the sample in all directions and, passing back through the objective lens, the dichroic mirror (this time transmitting the emission light), and another lens, hits a detector. This process forms an image captured by a digital camera. In conventional set-ups the image will be viewable through an eyepiece, so the viewer can make any real-time adjustments that might be needed.
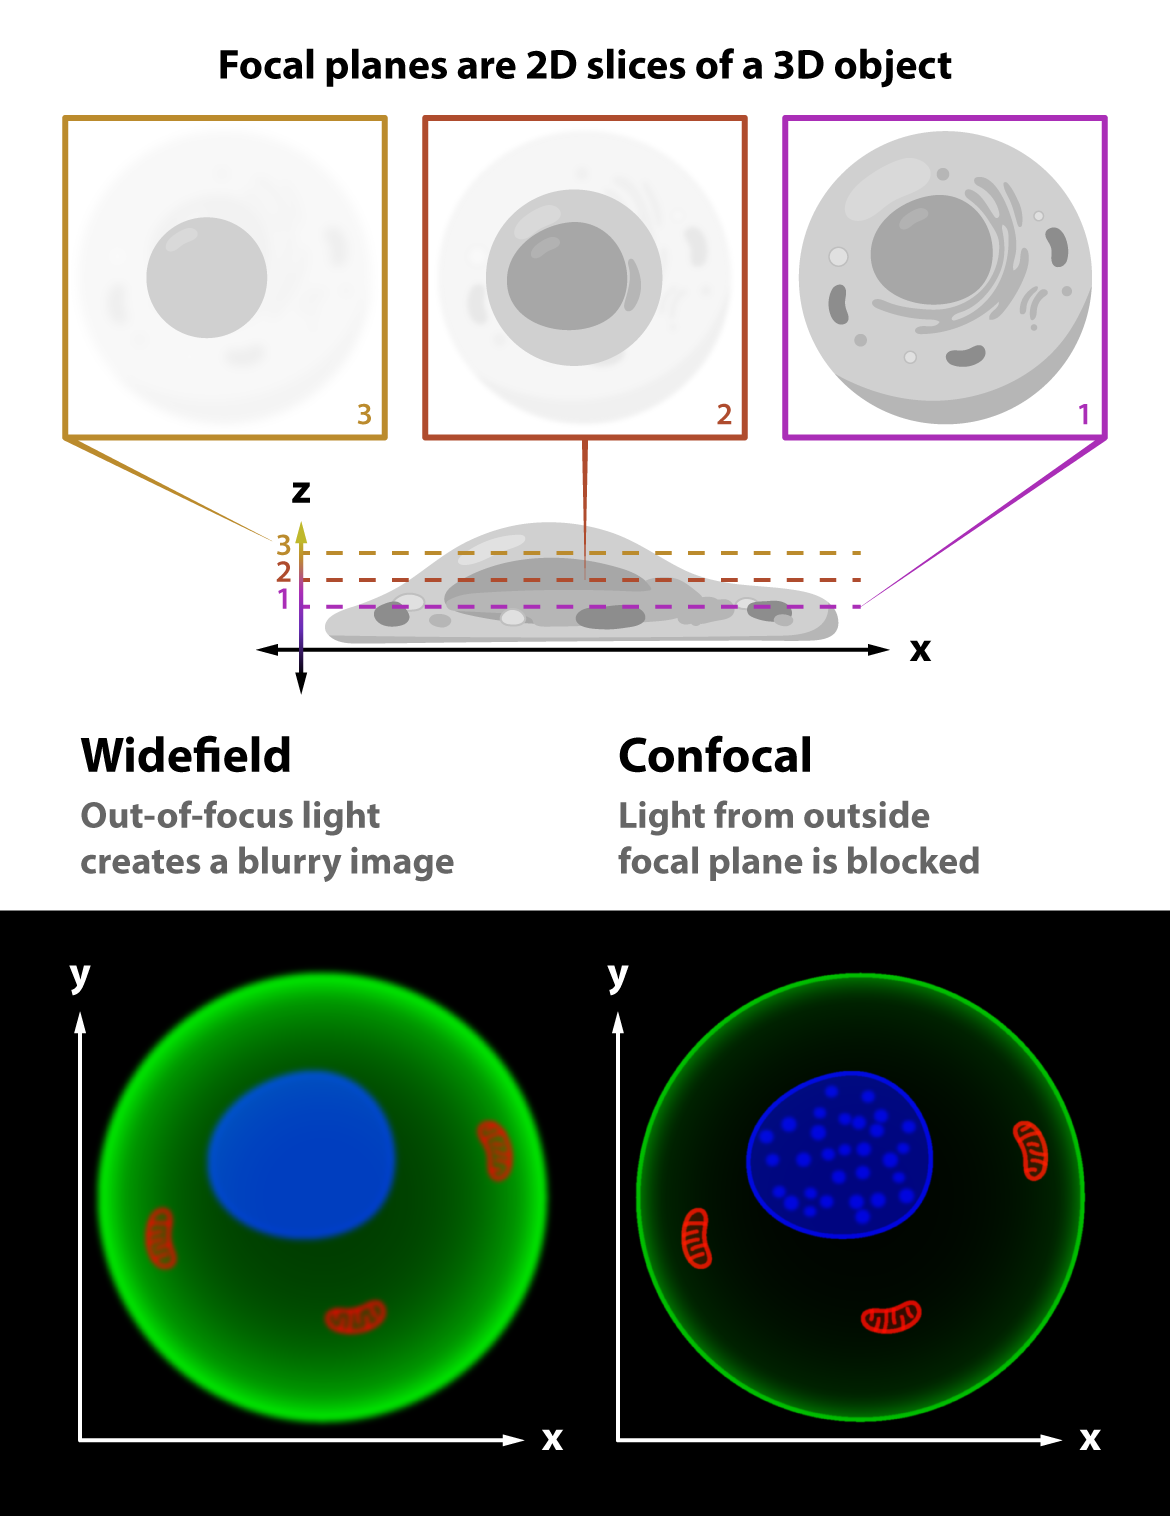
Widefield fluorescence microscopy is user friendly and relatively inexpensive. But because it illuminates the whole sample and allows light from the whole sample to emit in all directions, out-of-focus light ends up in the final image and contributes to a less-than-ideal signal-to-noise ratio. This is especially true for thick samples — posing a problem if the goal is to image deep inside tissue.
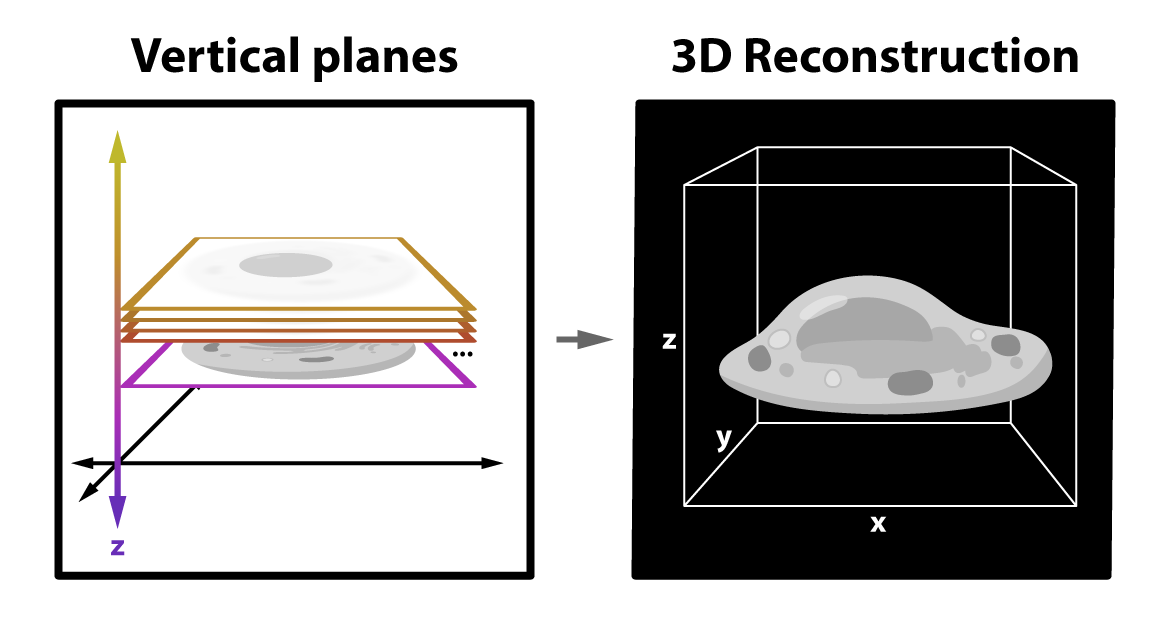
In contrast to widefield setups, confocal microscopy is more expensive and specialized, but brings several advantages. Confocal configurations generally use a laser rather than a lamp or LED illumination source, targeting a single point or line in the sample, and block out-of-focus emission light with a pinhole aperture (a fancy word for opening) placed in front of the detector. With this arrangement, only fluorescent light from the “focal plane” passes through the pinhole to the detector. The result is an “optical section.” Stacking up the multitude of optical sections with image processing tools produces high contrast three-dimensional images like the mouse embryo below.
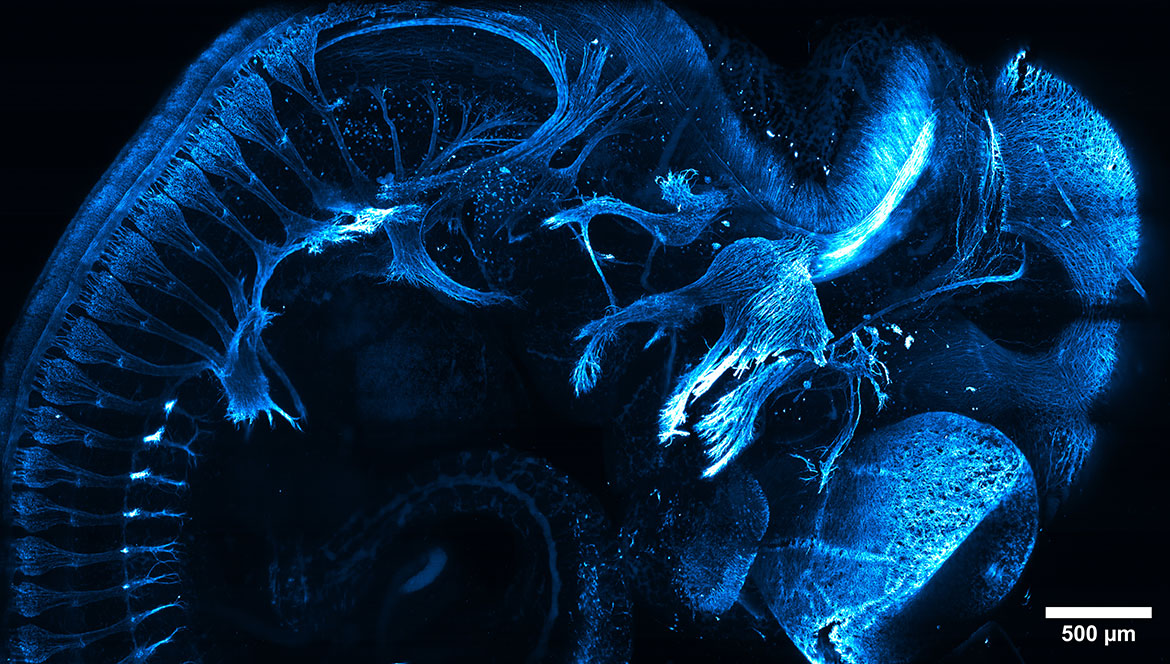
This mouse embryo, rendered transparent in a process called “clearing,” is immunostained so that part of its nervous system appears blue — revealing a clearly resolved cluster of neurons in the dorsal root of the spinal cord. Sample provided by Ivan Candido-Ferreira and imaged by Matthew Parent using a custom-built line confocal microscope in the Kumar Lab. Courtesy of Abhishek Kumar
Beyond the basics
Widefield and confocal techniques are just the tip of the fluorescence imaging iceberg. These other super cool approaches, often working in combination and on modified widefield or confocal set-ups, represent what’s possible with advanced optical engineering.
Lightsheet fluorescence microscopy — named for the sheet of light that illuminates the sample one focal plane at a time — blocks out-of-focus light similar in concept to confocal microscopy. This approach is ideal for large volumes like organs or embryos and for longer-term live cell imaging. Below it is applied to the neuromuscular system of an embryonic chicken wing.
Credit: Maëva Luxey, University of Basel, via Flickr
Total internal reflection fluorescence, or TIRF, targets key happenings at cell surfaces such as cell adhesion, when cells bind to each other or the extracellular matrix. In this video, two-dimensional TIRF microscopy captures the migration of salmon skin cells on a silicone gel coated with red fluorescent beads.
Credit: Barbieri et al., 2021
Super-resolution fluorescence imaging encompasses a suite of approaches that surpass the diffraction limit of light — allowing light microscopes to resolve objects smaller than 200 nanometers, including viruses, ribosomes, and proteins. Here, a super-resolution approach shows how much antioxidant protein (green) the cell is producing in developing fruit fly egg chambers; nuclei are stained white.
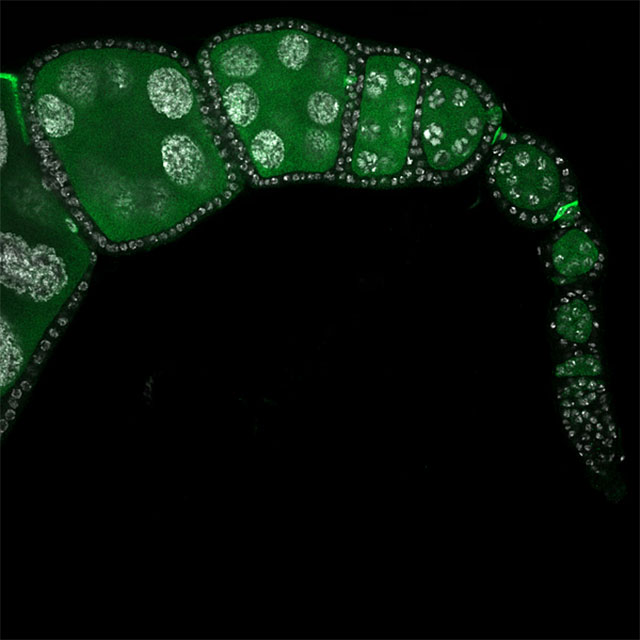
Credit: Ana Paiva Gandara
FRET, short for Förster resonance energy transfer, determines the distance between nearby proteins and other molecules to reveal critical information about molecular interactions. In this video, a FRET technique that uses alternating laser excitation was used to analyze the assembly of a signalling receptor in the plasma membrane.
Adapted from Winkelmann et al., 2024
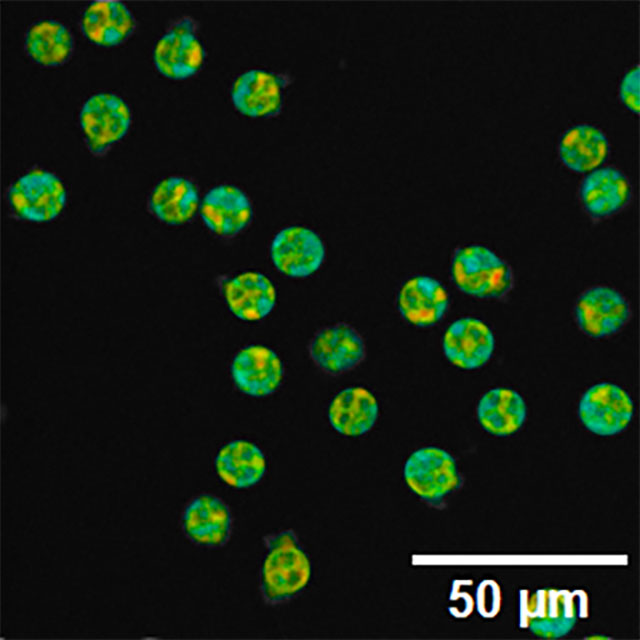
Multiphoton fluorescence imaging uses two or more lower energy photons to excite a single fluorophore out of the ground state, making this approach less damaging — and ideal for imaging live cells and tissues. Here the technique is applied to a mouse lymph node, identifying T cells, a type of immune cell, as red and autofluorescent metabolic cofactors as blue and green.
Scale bar, 50 micrometers. Credit: Alexa Heaton
FLIM, short for fluorescence lifetime imaging microscopy, reveals information about the molecular environment that traditional fluorescence microscopy, measuring the intensity rather than the time fluorophores spend in their excited state, cannot. Below FLIM illuminates the autofluorescent molecule NAD(P)H in human white blood cells.
Scale bar, 50 micrometers. Credit: Jorgo Lika and Rupsa Datta
Processing and interpretation
Across this diversity of techniques is a shared ultimate goal: giving scientists the best opportunity to answer their research questions by maximizing the meaningfulness of their images.
This goal requires modern computational techniques — machine learning and artificial intelligence algorithms that “see” images as a map of detected light divided into many evenly sized pixels. These pixels have different intensity values corresponding to how many photons are detected within their tiny piece of the larger map, and this is the basis for almost everything computation can do.
Depending on the technique, one of the first key steps is to reconstruct the image itself by “stacking” many two-dimensional optical sections together to form a three-dimensional image.
Processing this raw data requires enormous computing capacity. To visualize the development of mouse embryos in three dimensions, for example, researchers generated data sets each approximately ten terabytes — a digital volume that could hold the print collection of the U.S. Library of Congress in its entirety — and used additional software tools to manage this much data.
A developing mouse embryo (blue) imaged with lightsheet fluorescence microscopy. Computational tools enable the visualization of this process in space and time and automatic detection of cell division (superimposed colored spots). Credit: McDole et al. 2018
There are also an array of computational tools for enhancing — without distorting — image quality. These tools improve the signal-to-noise ratio (denoising), spatial resolution (deconvolution), and temporal resolution (automated imaging speeds adapted to the sample), among other opportunities to boost insight, like multicolor fluorescence (unmixing).
As powerful as visualizing microscopic life through fluorescence is, seeing is not quite the same as believing in contemporary bioimaging. Enter: quantitation. Quantitative measurements, not just visualization, inform rigorous comparisons across healthy and diseased cells, across different time points, and across other experiments. At the root of quantitation is accurate segmentation of the image, like in the video of cell migration below.
A tool called TrackMate allows us to follow the migration of cancer cells (left) in concert with a tool that first “segments” those cells called Cellpose (right). Adapted from ImageJ
With advances in machine learning and artificial intelligence accelerating across biology, new tools for extracting meaningful features from images and interpreting them are emerging virtually every day. Given the immensity and complexity of this landscape, the development of computational techniques for bioimaging has become a field in its own right. Luckily, as the field is guided by an “open-source” and community ethos, most of these tools are accessible through free software packages like ImageJ or Fiji.
However unfathomable these computational tools may have been to the first developers of fluorescence microscopy, this workflow is the product of centuries of innovative thinking and engineering. How did we get here, and where are we going?
A brief history of fluorescence imaging
Take a peak at the brick-by-brick history of fluorescence microscopy — an evolution that shows how science as we know it came slowly into being, one experiment at a time.
Sixteenth century: first recorded observations

The harvesting of coatli depicted in the General History of the Things of New Spain by the Spanish missionary Bernadino de Sahagún. Credit: Library of Congress
In the middle of the sixteenth century, two Spaniards independently described the fluorescent properties of coatli, the Nahuatl word for Mexican kidneywood, used by the Aztecs as a diuretic.
A flurry of discoveries two centuries later set in motion the progress towards modern fluorescence microscopy we recognize today.
Nineteenth century: foundational observations and theories
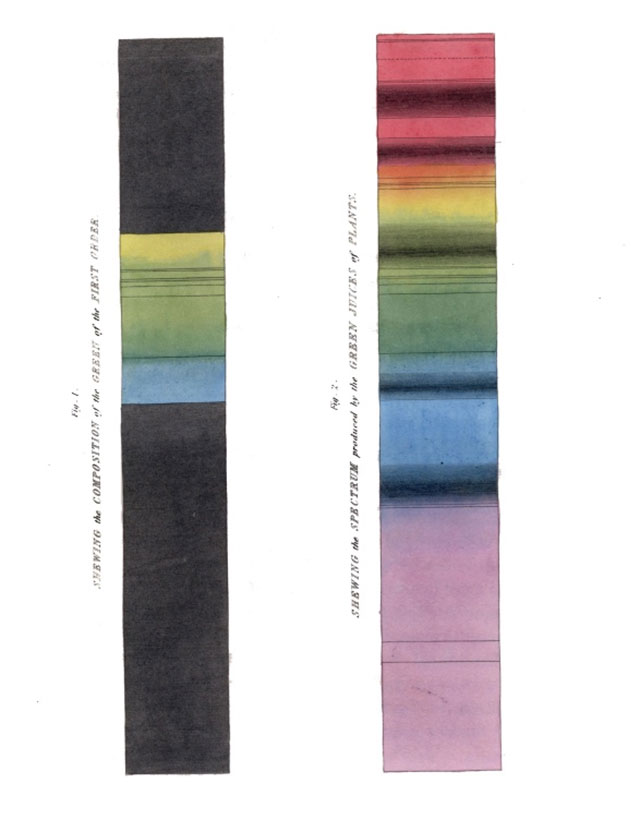
A plate from Brewster’s 1833 essay “On the Colours of Natural Bodies,” his study of colors reflected and transmitted by green plants.
In 1833, Sir David Brewster (already an inventor of the kaleidoscope) observed red light emanating from chlorophyll under white light.
And in 1845, Sir John Herschel (already an inventor of the blueprint) described how a solution of quinine — the bitter compound found in tonic water — glows with “an extremely vivid and beautiful celestial blue color” when held “under certain incidences of the light.”
Nineteenth century: foundational observations and theories
Building on Herschel’s observations and his own experiments, in 1852 Sir George Gabriel Stokes coined the word “fluorescence” in his famous essay “On the Change of Refrangibility of Light.”
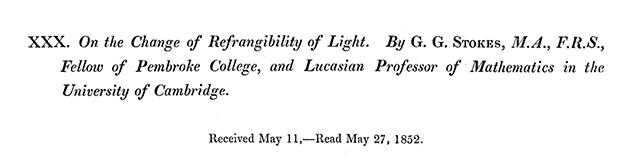
He also described the phenomenon now named for himself — the Stokes shift that you can see on the DAPI spectra above — showing how emitted fluorescent light has a longer wavelength than the absorbed light.
Some controversy ensued, with a French scientist claiming first discovery a decade prior and other scientists considering violations of “Stokes law” based on thermodynamics.
Twentieth century part I: first microscopes
The first fluorescence microscopes followed quickly on the heels of the first UV microscopes invented in 1904 by researchers at Zeiss, the optics corporation founded in Jena in 1846 and still in operation around the world today.
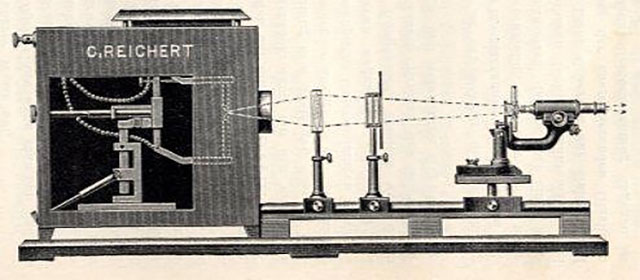
A rendering of Heimstädt’s fluorescence microscope for the Reichert optical group.
The early UV microscopes were costly to produce and difficult to use but paved the way for commercial fluorescence microscopes developed by Oskar Heimstädt, at the optics works company C. Reichert, in Vienna (1911), and Heinrich Lehmann at Zeiss (1913).
“If and to what degree fluorescence microscopy will widen the possibilities of microscopic imaging,” Heimstädt wrote at the end of Das Fluoreszenzmikroskop, “only the future will show.”
Twentieth century part II: immunofluorescence
Credit: Igbo et al., 2024
Scientists had been synthesizing fluorescent dyes since the 1870s by modifying chemical structures, especially the structure of xanthene.
The technique of “immunofluorescence” was born decades later at Harvard Medical School in 1941, when Albert Coons modified the xanthene-based fluorophore fluorescein so that it could be linked to an antibody, then used the conjugate to label bacterial polysaccharide on pneumococci in mice.
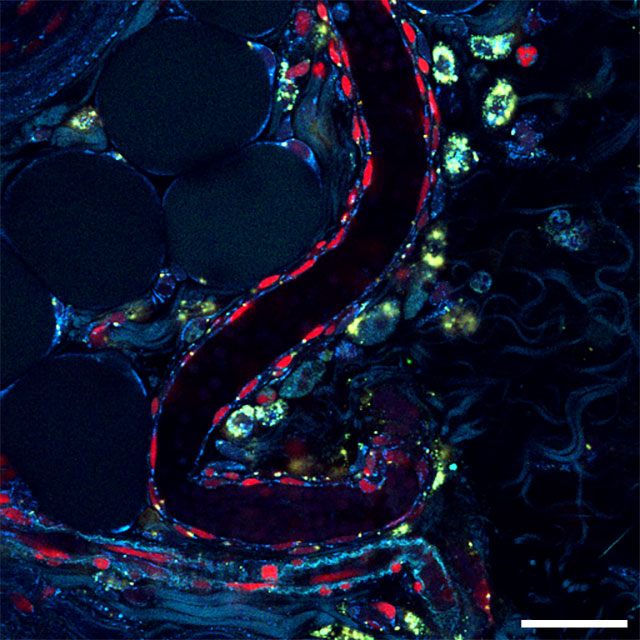
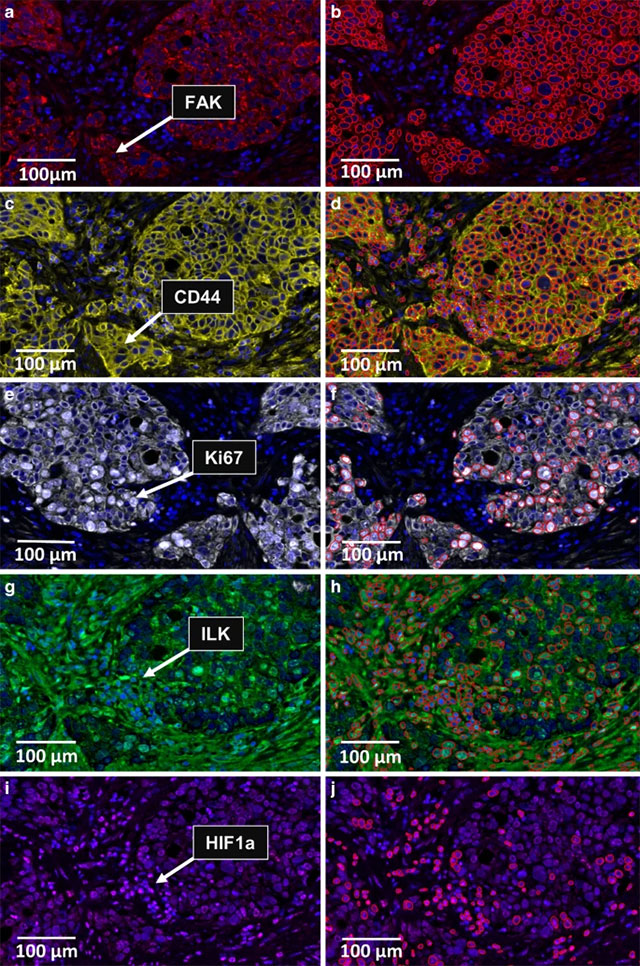
Now immunofluorescence is an indispensable technique for locating proteins and other molecules within cells. Here, a many-color “multiplex” format distinguishes several cell types in the tumor microenvironment of esophageal cancer.
Twentieth century part III: fluorescent proteins
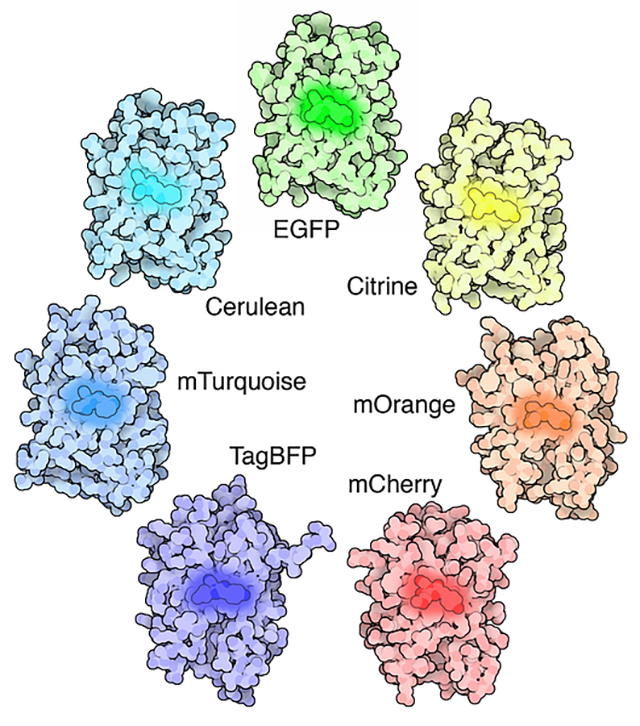
The structures of a variety of fluorescent proteins, with the chromophore responsible for their remarkable ability highlighted in the middle. Credit: Protein Data Bank
Fluorescent proteins — which unlike dyes can be inherited to track generational patterns — are the fruit of the GFP story unfolding across the second half of the twentieth century described above.
Those developments spurred research into brightly colored coral and sea anemones, and in 1999 the protein known as DsRed was isolated from a species of coral called Discosoma. Derivatives of DsRed like mCherry are widely used today and — as their name implies — cover a slice of the color spectrum not accessible via GFP derivatives.
Twenty-first century: tiny molecules, “Big Data,” and beyond
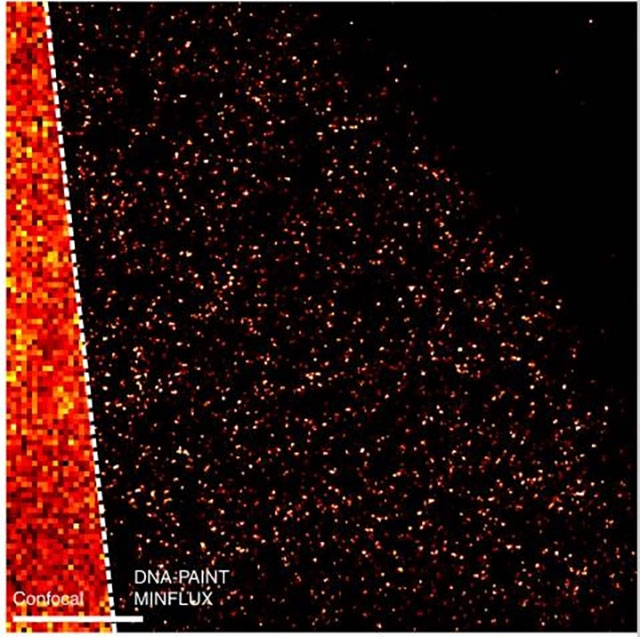
Confocal versus super-resolution microscopy in the form of DNA-PAINT MINFLUX, applied to mitochondria in human cells; scale bar is 0.5 micrometers. Ostersehlt et al., 2022
Fluorescence microscopy had become a widely popular approach by the turn of the century. But amazing advancements still lay ahead.
In 2000 and 2006, scientists used fluorescent techniques to break past the diffraction limit and achieve “super resolution” for the first time, resolving single small molecules like proteins. These feats earned them the Nobel Prize in Chemistry in 2014.
These high resolution approaches create massive, massive amounts of data, ushering in an era sometimes called “Big Data.” This and other developments in machine learning, artificial intelligence, and high throughput computing have reshaped the way microscopes can be used, images can be processed, and data can be stored and searched.
The future of fluorescence microscopy at Wisconsin
The University of Wisconsin–Madison and the Morgridge Institute for Research have built a nexus of researchers who are pushing biological optical microscopy — including and beyond fluorescence — at all of its edges. Working together and with collaborators across the globe, these labs are engineering transformative label-free techniques, cutting-edge hardware, artificial intelligence that may one day offer the path to a “virtual cell,” and more.
Skala Lab: Eavesdropping on cells with optical metabolic imaging

Melissa Skala
The lab of Melissa Skala, Morgridge investigator and professor of biomedical engineering at UW–Madison, pioneers label-free methods for a remarkably wide range of biomedical questions. One of the group’s key advances, a technique called optical metabolic imaging, measures the fluorescence intensity and lifetimes of nicotinamide adenine dinucleotide phosphate, or NAD(P)H, and flavin adenine dinucleotide, FAD. These coenzymes are found in all cells, where they play a crucial role in almost all metabolic reactions. And because they are highly sensitive to changes in the metabolic state of the cell, they provide a helpful indicator of cell health and disorder. In combination with their inherent ability to fluoresce, this makes NAD(P)H and FAD excellent accidental informants on the cell dynamics at play in applications ranging from oncology to neuroscience to tissue engineering.
“We’re making tools that can be used in very creative ways across disciplines and on many different problems, and I think that’s what makes them impactful,” Skala says. “And when you make tools easier for others to use, the applications multiply and you don’t know where it’s going to go. That’s the fun part!”
Skala lab scientists capture autofluorescence intensity (left) and mean lifetime (right) of NAD(P)H in mouse melanoma cells. (Scale bar, 50 micrometers). The FLIM image is more comprehensive and shows the heterogeneity that exists even within a monolayer of cells in culture. Warmer colors (reds, yellows) indicate where NAD(P)H is active in the mitochondria (a longer mean lifetime) and cooler colors (blues, greens) indicate where NAD(P)H is active in the cytoplasm (shorter mean lifetime). As pioneers of tools that capture this kind of information in a non-destructive, label-free way, the Skala Lab collaborates with biomedical researchers asking a wide variety of questions. Credit: Alexa Heaton
Brockman Lab: Probing cellular mechanobiology with fluorescence

Joshua Brockman
Biomedical Engineering Assistant Professor Joshua Brockman and his lab members use fluorescence microscopy to examine the mechanical forces exerted at cellular receptors. By better understanding how the receptors on, say, immune cells mechanically function, they hope to inform and improve the design of immunotherapies and more.
“You can use fluorescence to report a whole lot of things,” Brockman says. “We use it to predict the location of receptor-generated piconewton forces, but you can use it to report voltage, you can use it to report salt concentrations, you can use it to report the location of an individual protein that you’re interested in in live cells If you’re clever, you can use fluorescence to take something invisible and turn it visible.”
The molecular-tension probes Brockman’s group has designed attach to cellular receptors — such as the T cell receptor, which regulates if and when T cells kill virally infected or cancerous cells — and open like bobby pins when force is exerted, emitting fluorescence. Those forces are incredibly tiny, at the piconewton scale — roughly one-trillionth the force required to lift an apple. The Brockman Lab is also using machine learning to make predictions about force locations.
The probes designed by the Brockman group locate T cell receptor forces with nanoscale resolution. Credit: Joshua Brockman
Bartels Lab: Unlocking the power of quantum correlations for dynamic super-resolution microscopy
Randy Bartels
Having launched his scientific career as a physicist, Morgridge Investigator and Professor of Biomedical Engineering Randy Bartels now innovates cutting-edge techniques to manipulate light so that especially difficult-to-access cellular and subcellular dynamics can be observed and measured.
Prevailing super resolution approaches, for example, are constrained by slow imaging speeds and shallow imaging depths, limiting the kind of biology that can be studied. The Bartels group is developing a new approach in localization microscopy to enable dynamic high-speed super-resolution microscopy capable of revealing dynamic organelle interactions in the cell. “We want to push past the barriers of current fluorescent microscopy to reveal the structure and dynamics of organelles across the cell so we discover their internal dynamics, or their lives, and how they interact — the way they socialize,” Bartels says.
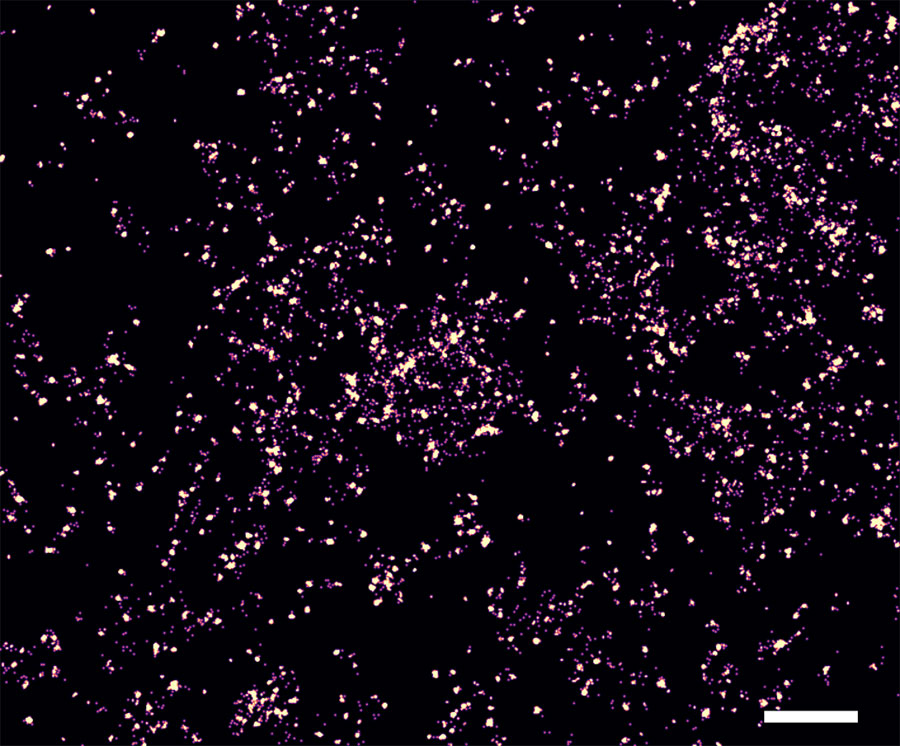
The concept is to modulate illumination light in space and time such that a large volume of the sample can be illuminated simultaneously and the location of each fluorophore can be labeled with a uniquely timed intensity pattern. Then, the known illumination pattern that varies spatially can be matched to the patterns of fluorescent emission signals recorded by a photon counting detector array. The challenge with localization microscopy is the density of the emitters: too many fluorescence emissions in too small an area makes for overlapping signals and prevents the extraction of super resolution information. Information available in classical light imaging is limited and modern microscopes are up against limits of what information can be extracted from conventional images. To overcome this challenge, the Bartels Lab leverages quantum correlations hidden in the photon statistics of light. By extracting quantum correlations from the imaging data — put simply, more information can be unlocked by understanding the quantum behavior of the fluorophores — this strategy becomes a quantum-enhanced computational super-resolution imaging method.
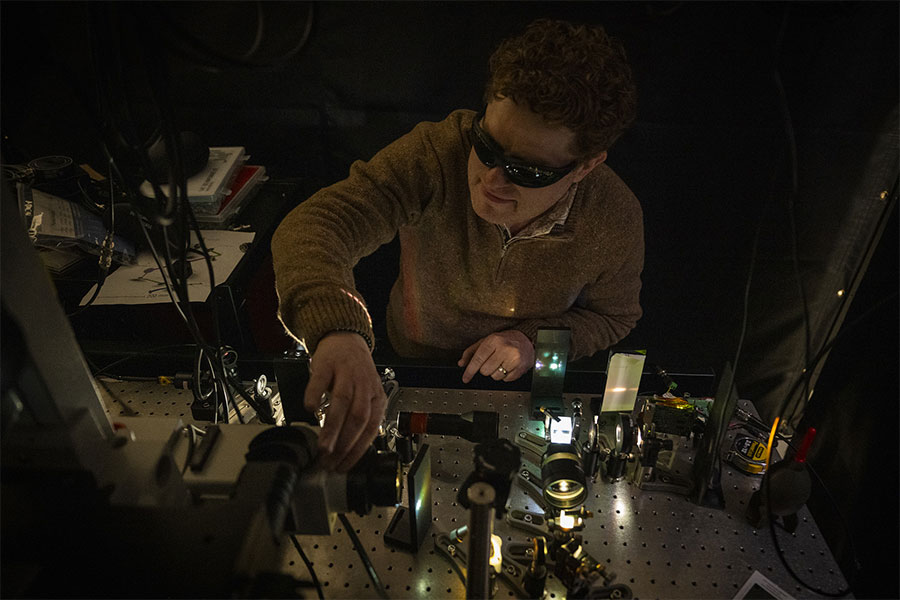
Bartels aligns the quantum correlation super resolution microscope. Credit: David Nevala
Caicedo Lab: Getting the most out of fluorescence microscopy, and then some

Juan Caicedo
Fluorescence microscopy images contain incredibly complex and an incredible amount of information, a challenge that will only intensify with new generations of instrumentation and with the ability to collect and store more images.
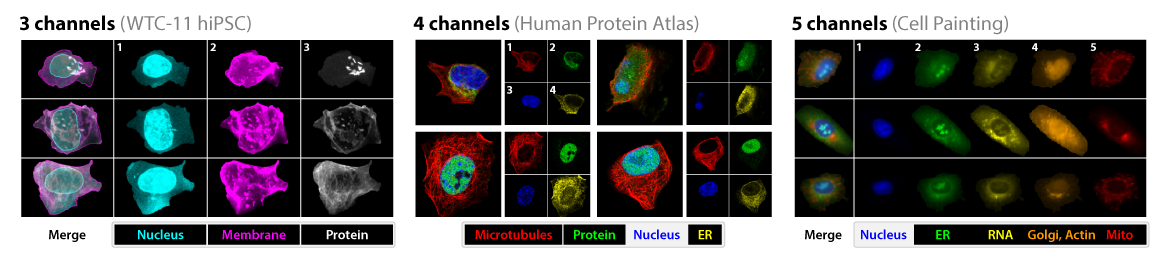
The Caicedo Lab, led by Morgridge Investigator Juan Caicedo, develops machine learning and artificial intelligence tools that help digest every bit of that complexity into quantifiable, reproducible, and computable information about cell state and cell structure. Emphasis on every bit. Machine learning approaches developed to date often target specific aspects of cellular biology in microscopy images, like protein localization. The mission of the Caicedo Lab is to create tools for comprehensive profiling of the cell. This is the basis for a universal reference of cell morphology that accounts for shape, size, appearance, structure, and function.
“The cell is a lot more intelligent than we think,” Caicedo says. “We cannot reduce it to, say, what the genes say the cell is going to do. The combination of molecular, chemical, and structural activity that the cell has is incredibly intelligent and incredibly complex, and we’re trying to decode microscopy images to find out how it works — why the cell makes the decisions it makes.”
The reference Caicedo’s group is building will ultimately be useful in the building of a virtual cell — a science-fiction-esque dream that modern computer science has brought into the realm of real possibility. This would enable the simulation of biological experiments that we have not yet explored, opening investigations of health, disease, and response to treatments simply not possible with human and model organisms.
Underlying all of this is fluorescence, visible here as in different “channels” representing different color wavelengths in the datasets used to train one of the Caicedo lab’s models.
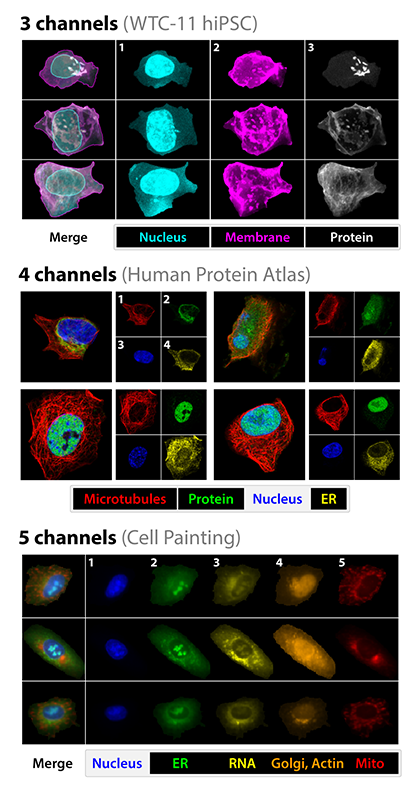
Different “channels” representing different color wavelengths in the datasets. Adapted from Doron et al., 2023.
LOCI: Building tools and communities

Kevin Eliceiri
Another longtime innovator of label-free microscopy, Morgridge Investigator and UW–Madison Professor of Medical Physics and Biomedical Engineering Kevin Eliceiri harnesses the intrinsic optical contrast of the cellular microenvironment to study diseases in a non-invasive way and at multiple scales, from the cell all the way to the whole tumor or organ. He also leads the Morgridge FabLab, an imaging-focused instrumentation laboratory that has served as a hardware development hub for many optics labs at Morgridge and UW–Madison. With Abhishek Kumar, assistant professor of cell and regenerative biology, Eliceiri heads up the Laboratory for Optical and Computational Instrumentation, or LOCI at UW–Madison, a collaborative instrumentation laboratory based in the Center for Quantitative Cell Imaging in the Office of the Vice Chancellor.
Besides advancing instrumentation to better visualize disease, Eliceiri’s work at LOCI and beyond is defined by broadening access to innovation. Resources — from the experts themselves to advanced hardware to computational capacities — remain limited at many institutions, can easily become siloed even in research-intensive environments, and can prove impractical in clinical settings. Overcoming these bottlenecks motivates Eliceiri not just to cultivate an “open hardware” movement, but to build broad networks of people. For example, he is the co-director of the Center for Open Bioimage Analysis, or COBA, home to ImageJ software development. COBA also sponsors a thriving discussion forum on image processing and analysis called image.sc (BINA) that sees over one million visitors each month. Eliceiri is also the co-chair of Bioimaging North America (BINA), an organization (housed at Morgridge) that connects imaging scientists from across the continent to accelerate their growth and that of the field. In 2024, Madison hosted the BINA Community Congress international imaging meeting, with over 300 attendees, and will return as host in 2026.

Abhishek Kumar
An expert in lightsheet microscopy, Kumar builds bridges between imaging experts and biologists with two motivations: to help biologists answer their motivating question by utilizing cutting-edge imaging technologies, and to help discover where the tools he makes can be pushed to answer more and more complex questions. “Fluorescence imaging lets us visualize and localize interactions of molecules and proteins within live and intact tissues,” Kumar says, “and it now can do so at the spatial scales necessary to elucidate fundamental biological processes and mechanisms at cellular and molecular levels.” In particular, Kumar is currently exploring new approaches to advance fluorescence imaging of large and complex tissues by integrating innovative optical designs with nanophotonic technologies and leveraging deep learning — the “C” in LOCI — for image enhancement and analysis. Both Kumar and Eliceiri have led lightsheet development centers funded by the Beckman Institute (Eliceiri with Morgridge affiliate and lightsheet expert Jan Huisken).
LOCI itself is part of a research ecosystem at Madison that nurtures innovation not just in fluorescence microscopy but in many other optical techniques for probing biology that use other sources of contrast. In the Department of Biomedical Engineering, for example, the Paul Campagnola Lab exploits light–matter interaction, in particular second harmonic generation, to study how the collagen-rich extracellular matrix is remodeled in cancer and connective tissue disorders, while the Filiz Yesilkoy Lab leverages the vibrational resonances serving as molecular “fingerprints” and the polarization of light to paint a rich picture of tissue morphology and biochemistry, with applications ranging from basic biology to clinical diagnostics.
Multiplied by the many other scientists (many of them below!) at Madison working to advance the state of the art in optical imaging to a new frontier — and the countless current and future biologists who will use these tools to answer pressing questions about the nature of life — the impact of this imaging community stretches far beyond its borders. As Eliceiri says, “The great strength of UW–Madison and Morgridge is cross-field collaboration, and the biomedical optics community exemplifies this by working closely with many fields to help solve cell-based mysteries in normal and abnormal development.”

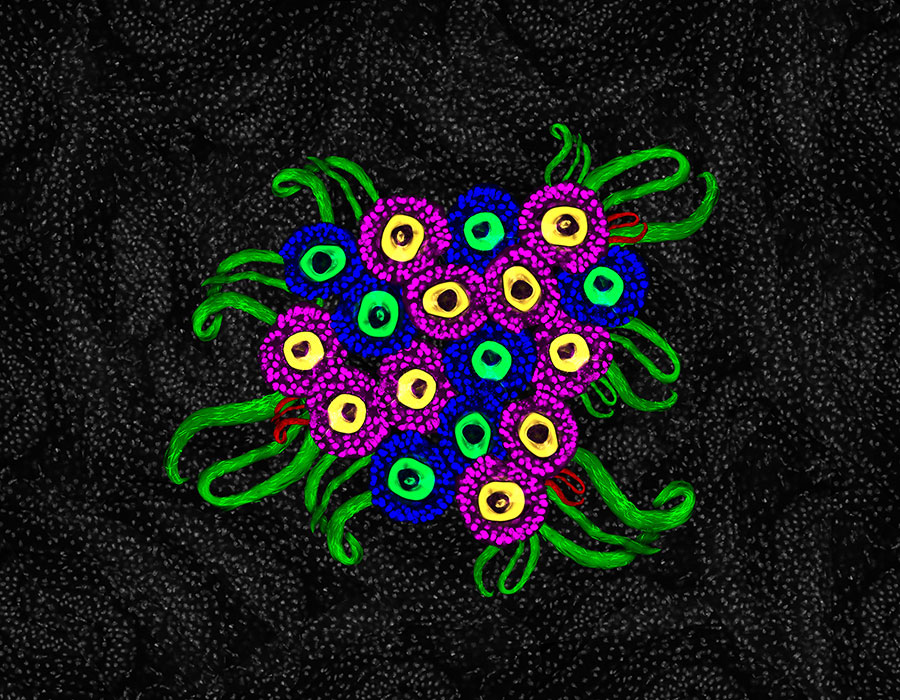
A bouquet of fluorescently labeled fruit fly reproductive organs composed by Madison scientist Ana Paiva Gandara.
An engine of discovery
Consider this: a sequence of just three amino acids create the chromophore at the heart of the green fluorescent protein that allows it to glow. Our ability to harness this glow powers the pursuit of thousands upon thousands of experiments across the world. And thousands more enlist other fluorophores — some of them native to our own cells and tissues.
With these tiny biochemical structures, we can ask big questions: How does our immune system fight the spread of cancer? Why do some organisms regenerate their own tissues? How do differentiating cells move, take shape, and determine their fate?
To answer these and other questions with fluorescence, scientists marry the fundamental physics of light with the ingenuity of human engineering. Optical instruments deliver carefully calibrated energy to a cell, tissue, or organism, inducing and then detecting fluorescence, and computational tools process and help us interpret these images.
This system is in constant motion, fueled by scientific curiosity. Every time biologists unlock a new discovery, we find out where tools like fluorescence microscopy need to evolve. And with untold biological questions remaining to be answered, it’s safe to say the future of fluorescent microscopy is bright.